The building blocks of Northern Hemisphere stationary waves
Published:
Please see our new paper exploring stationary waves in the Northern Hemisphere, just accepted in the Journal of Climate. What are stationary waves, you ask? In laymen’s terms, they are variations in climate with longitude, for example, the reason why the weather in Madrid is quite different from that here in New York, even though we’re both situated at nearly the exact same latitude.
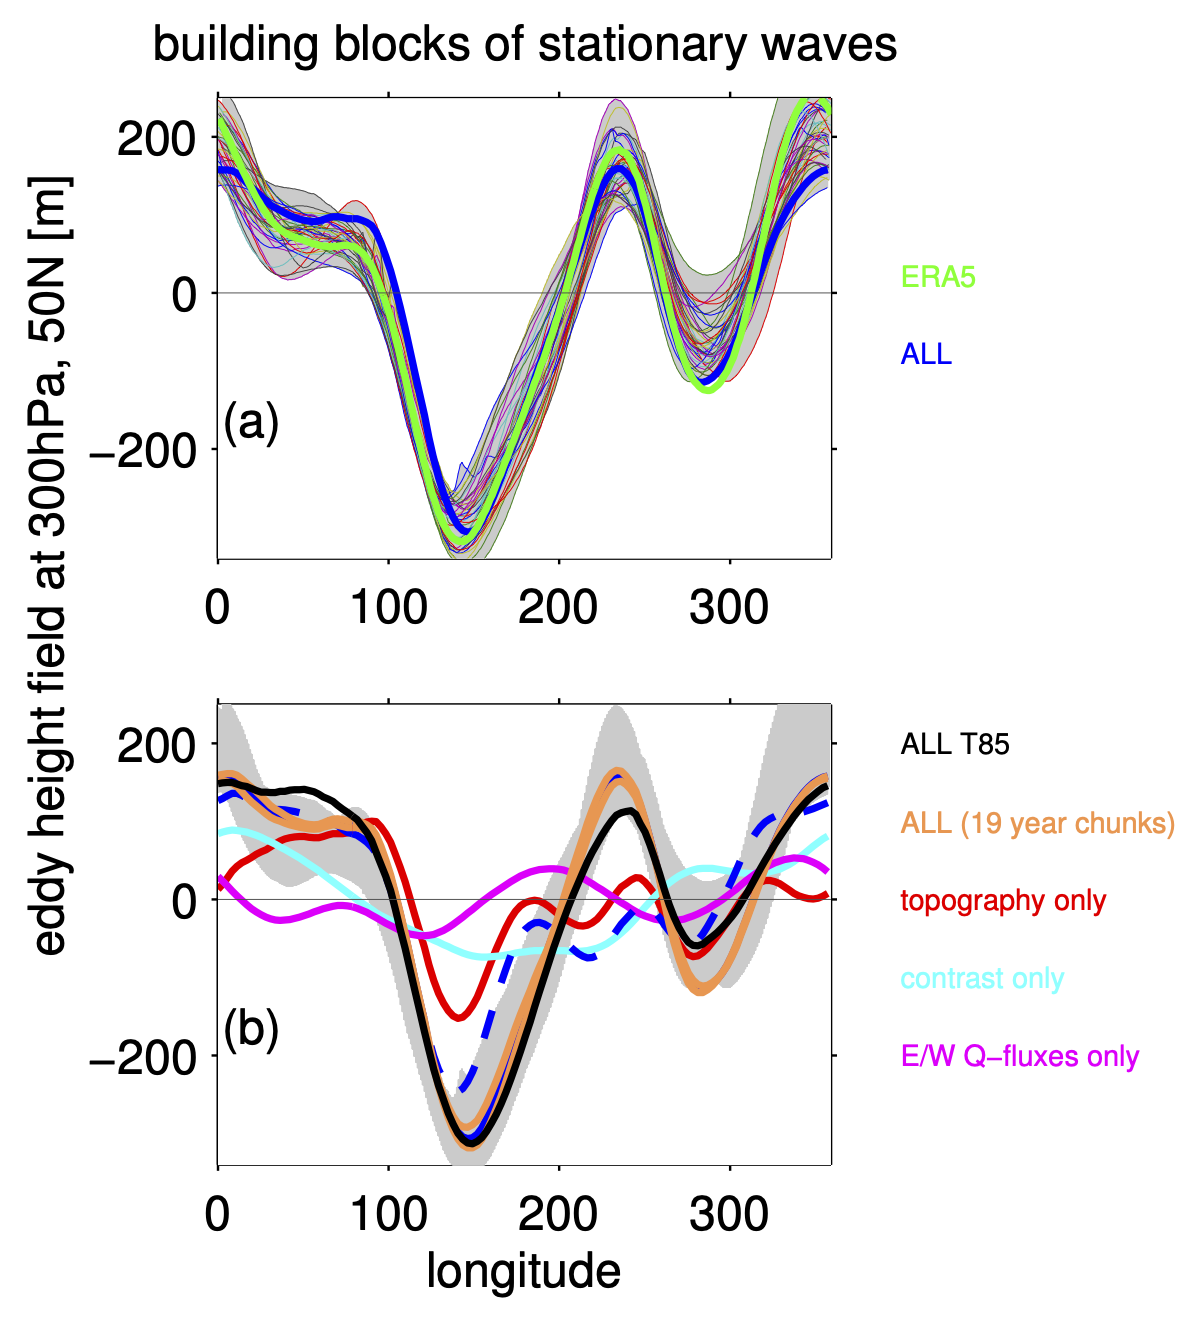
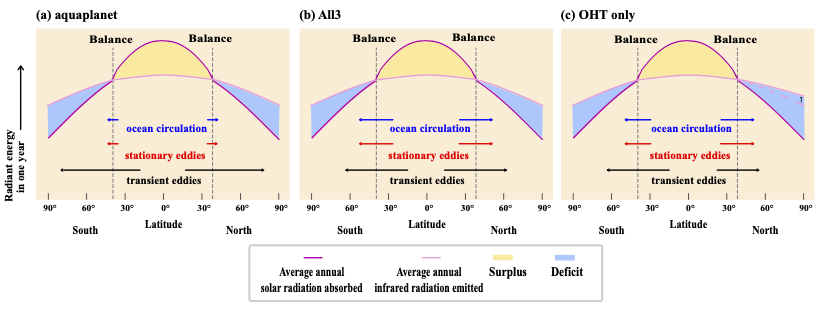
This study, lead by Chaim Garfinkel, investigates the processes that create these variation in climate, focussing on the atmospheric circulation. We can quantify stationary waves by looking at variations in geopotential height, which is related to the lows and highs on a weather map. First, we constructed a simple model (the blue curve in the top panel above) that does just as good a job at creating variations in the real circulation (green curve) as state-of-the-art climate models (all the thin lines). This wasn’t a trivial result: a handful of us are competing with world class modeling centers! (Of course their models are better for climate prediction; our model is designed more for understanding the climate.)
We then broke down the processes that create these variations, including topography, land sea constrast, and variations in sea surface temperatures. The response of the atmosphere to these “forcings” is nonlinear, that is, more than just the sum of the invidual parts, as shown in the panel of the figure above.
This research was based on an idealized atmospheric model, MiMA developed by my former postdoc, Martin Jucker. I’ve been fortunate to continue collaborating with Martin, who’s a coauthor on this study.